
- Tailored to your requirements
- Deadlines from 3 hours
- Easy Refund Policy
Importance of Demand and Supply Forecast
By description, demand forecasting is the process of understanding and approximating future customer demand over a certain time. The process involves the use of historical sales data along with seasonal variances and information to ensure the most precise forecasts. The demand and supply forecast is one of the most essential tools in a business’s arsenal. By understanding what customers want and how much of it they are willing to buy, businesses can make informed decisions about production levels and pricing (Wang et al., 2021). In the absence of demand forecasting, a business would make poor pricing decisions, which also affects supply chain management, customer satisfaction, and profitability. By the same token, demand and supply forecasts can help businesses anticipate changes in the market and adjust their plans accordingly. To that end, forecasting helps in pricing, business planning, budgeting, setting goals, and estimating profit margins.
Several different methods can be used to create a demand and supply forecast. As Gupta, Nanjundan, and George (2024) report, the most important thing is to use the method that makes the most sense for a particular business and product. Some standard methods include trend analysis, sales force composite, market research, Delphi method, and statistical modeling. Upon obtaining the historical sales data and selecting the appropriate method, an analysis of the demand and sales forecast would allow a business to make informed decisions. The data can come from various sources, including customer surveys, sales records, and market data. After obtaining the historical sales data, it is essential to analyze the patterns and trends followed by creating forecasts. Important to note that a demand and supply forecast is a different science. There will always be some uncertainty involved (Wang et al., 2021). However, using the best method for a business to gather accurate data and create a demand and supply forecast that will give a good idea of what to expect in the future. The forecast can help businesses make informed decisions about production levels and pricing. Moreover, it can help a business anticipate changes in the market and adjust plans accordingly.
An Overview of Trend Analysis Method
The demand and supply forecast based on trend projection uses historical data to approximate future sales of a business. Trend analysis stands as the simplest and forthright method of demand forecasting. The method provides a roadmap for adjusting future projections to account for any previous anomalies. An analysis of historical sales performance is important in identifying seasonal variations, including peak seasons. Also, it is important to identify the seasons with low customer demand (Gupta et al., 2024). A decrease in demand presents an opportunity for presenting pricing campaigns or implementing a markdown pricing approach to increase product or service uptake.
Leave assignment stress behind!
Delegate your nursing or tough paper to our experts. We'll personalize your sample and ensure it's ready on short notice.
Order nowDemand and Supply Forecast for iPhones using the Trend Analysis Method
Apple's iPhone sales have been steadily increasing since the product was first introduced in 2007. In the early years, sales were driven mainly by early adopters and tech-savvy consumers. However, sales have grown exponentially as the product has become more mainstream. In recent years, iPhone sales have been driven by a combination of factors, including the release of new models, increased marketing efforts, and global expansion.
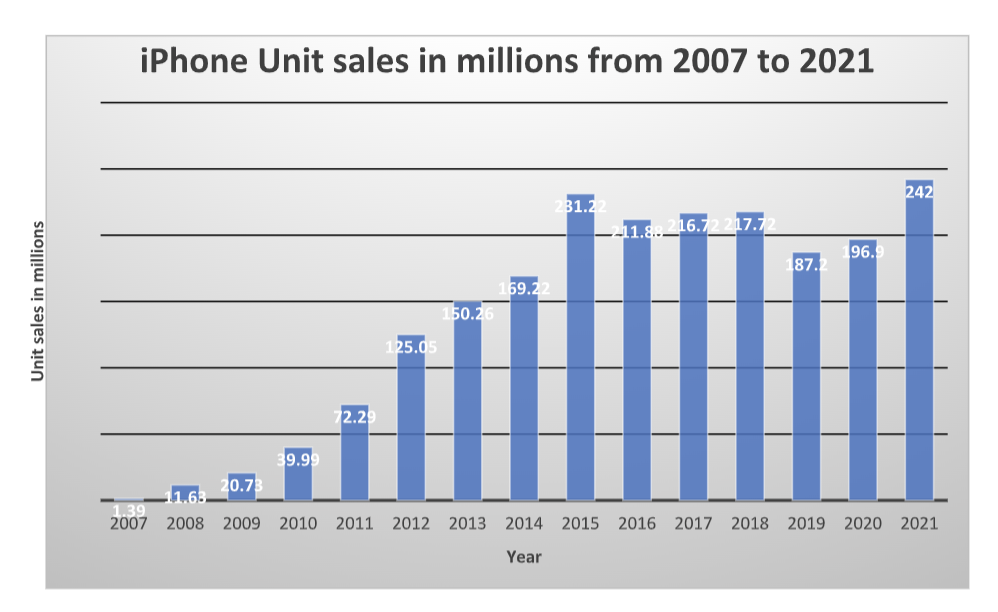
Figure 1: iPhone unit sales in millions from 2007 to 2021 (Curry, 2022).
Between 2007 and 2021, Apple sold a total of 2.09 billion iPhones. In 2007, the iPhone was introduced to the market with a price tag of $499 (see Figure 1). In the first year, Apple sold 1.39 million iPhones. This number grew to 11.63 million in 2008 and then exploded to 20.73 million in 2009. Sales continued to grow, reaching 150 million in 2013 and then topping out at 231 million in 2015 (Curry, 2022).
In 2017, the iPhone 8 and iPhone X were released, helping sales reach 216 million. In 2018, the iPhone XS and iPhone XR were released, and sales reached 217 million. Finally, in 2021, the iPhone 13 was released, and sales reached a new record of 242 million. After a slight dip in 2016, sales began to grow again, reaching 242 million in 2021 (see Figure 1).
Looking to the future, it is clear that Apple's iPhone sales show no signs of slowing down. With new models being released on a regular basis and global expansion continuing, sales are likely to continue to grow. As such, businesses must keep up with the latest trends and understand how the iPhone market is evolving. This will allow them to make informed decisions about production levels and pricing. Additionally, it will help them anticipate changes in the market and adjust their plans accordingly.
Forecasting supply and demand for iPhone sales for the next decade
In order to forecast the supply and demand for iPhone sales for the next decade, using trend analysis, one should calculate the average growth rate of sales between 2007 and 2021. Assuming that Apple continues to release new models and the market maintains similar enthusiasm for the iPhone brand, sales are expected to grow exponentially (see Table 1).
|
Apple iPhone annual sales worldwide from 2007 to 2021 | ||
|
Year |
Unit sales in millions |
Sales growth |
|
2007 |
1.39 |
88% |
|
2008 |
11.63 |
44% |
|
2009 |
20.73 |
48% |
|
2010 |
39.99 |
45% |
|
2011 |
72.29 |
42% |
|
2012 |
125.05 |
17% |
|
2013 |
150.26 |
11% |
|
2014 |
169.22 |
27% |
|
2015 |
231.22 |
-9% |
|
2016 |
211.88 |
2% |
|
2017 |
216.72 |
0% |
|
2018 |
217.72 |
-16% |
|
2019 |
187.2 |
5% |
|
2020 |
196.9 |
19% |
|
2021 |
242 | |
|
total |
2,094.2 | |
|
Average growth rate |
23% | |
Table 1: iPhone sales growth rate (Curry, 2022).
The average growth rate of iPhone sales has been 23%. Using the growth rate, a figure can be extrapolated to forecast sales for the next decade, which will then be used to inform demand, as seen in Table 2 below. According to the demand forecast, Apple is expected to sell over 11 billion units of iPhones in the next decade. By 2032, Apple will have sold over 2.3 billion units in that year alone.
|
Apple iPhone sales forecast in the next decade | ||
|
Year |
Unit sales in millions |
Growth rate |
|
2021 |
242 |
23% |
|
2022 |
297.66 | |
|
2023 |
366.1218 | |
|
2024 |
450.329814 | |
|
2025 |
553.9056712 | |
|
2026 |
681.3039756 | |
|
2027 |
838.00389 | |
|
2028 |
1030.744785 | |
|
2029 |
1267.816085 | |
|
2030 |
1559.413785 | |
|
2031 |
1918.078955 | |
|
2032 |
2359.237115 | |
|
total |
11,564.61588 | |
Table 2: Apple iPhone sales forecast in the next decade
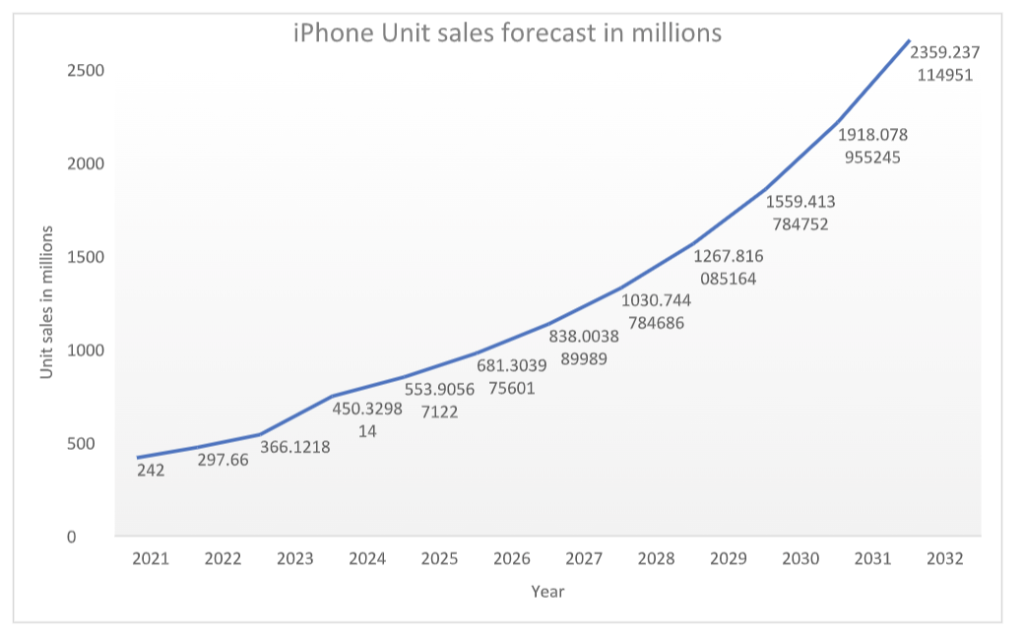
Figure 2: Apple iPhone sales forecast in the next decade
Recommendations
The objective of the demand and supply forecast is to reduce costs by increasing efficiency within the supply chain. In line with the sales data, it is evident that Apple's iPhone is a top-rated product. As such, businesses should keep up with the latest trends and developments in the iPhone market to maintain the 23% growth rate. Additionally, they should monitor future releases and be prepared to adjust their production levels and pricing accordingly. Finally, businesses should monitor the global market for iPhones and be prepared to expand their operations if necessary.
Offload drafts to field expert
Our writers can refine your work for better clarity, flow, and higher originality in 3+ hours.
Match with writerReferences
- Curry, D. (2022). Apple Statistics (2022). Business of Apps. Retrieved from https://www.businessofapps.com/data/apple-statistics/ on July 23, 2022.
- Gupta, A., Nanjundan, P., & George, J. P. (2024). Demand and Supply Forecasts for Supply Chain and Retail. In Artificial Intelligence in Forecasting (pp. 333-340). CRC Press.
- Wang, W., Lin, W., Cai, J., & Chen, M. (2021). Impact of demand forecast information sharing on the decision of a green supply chain with government subsidy. Annals of Operations Research, 1-26.
