
- Tailored to your requirements
- Deadlines from 3 hours
- Easy Refund Policy
Graph 1: Return on Equity (ROE) from 2020 to 2023 5
Liquidity and Short-Term Financial Health 6
Table 1: Financial Ratio Comparison (2020 to 2023) 7
Long-Term Solvency and Capital Structure 8
Revenue Growth and Top-Line Performance 9
Graph 2: Revenue Growth Rates (%): BMW vs. BYD (2020–2023) 9
Cash Flow and Financial Flexibility 11
Key Drivers of Financial Outcomes 12
BMW: Premium Positioning with Stable Cost Structure 12
BYD: Aggressive Expansion with Economies of Scale in COGS 13
Comparative Insight: What Drives Financial Outcomes? 14
Non-Financial Performance (2020–2023) 15
Brand Reputation and Customer Satisfaction 18
Comparative Analysis (2020–2023) 19
Key Differences and Similarities 19
Impact of Strategic Decisions 20
Long-Term Sustainability of Performance 20
Appendix 1: BMW AG (2020–2023) 25
Appendix 2: BYD Company Ltd. (2020–2023) 27
Introduction
This report covers the BMW Group and BYD Company Limited’s financial and non-financial performance analysis between the years 2020 to 2023. It is done as an internal report for investment advisory. Its primary purpose is to give recommendations enabling investors to make sound decisions on an investment opportunity. The strategic aims of the report include the evaluation of strategic management decisions, the financial ratio analysis, the evaluation of ESG initiatives, and the competitive positioning. These are profitability, liquidity, solvency, efficiency, and sustainability measures over the four years. It is critical to note that the two firms have had a divergent approach regarding the transition to EVs and the ESG pressures. Thus, their financial futures and reputational vulnerability differ. The analysis aims to identify which of the two firms is better positioned for the current market environment and presents a more favourable investment opportunity.
Financial Performance of BMW and BYD (2020–2023)
Profitability Performance
Gross Profit is a primary measure indicating the Company's ability to generate earnings from operations. From these, Return on Equity (ROE) gives more information about the efficiency of using shareholders' funds. The presented ROE for BMW Group and BYD Co. are shown in Graph 1 below.
Graph 1: Return on Equity (ROE) from 2020 to 2023
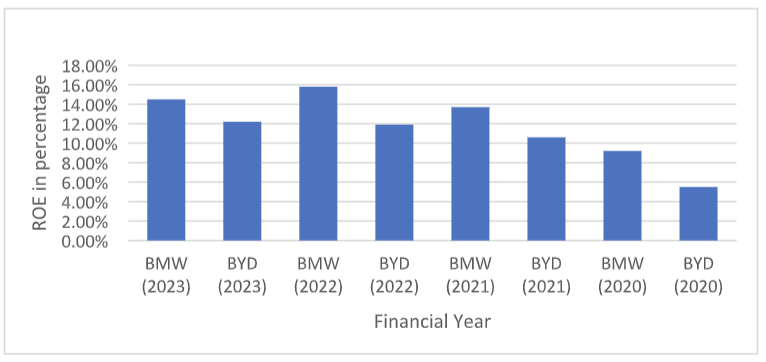
BMW Group has maintained a high level of ROE for the period under review, and although it slightly declined from 15.8 % in 2022 to 14.5% in 2023, this is still a respectable figure (BMW Group, 2021, 2022, 2023). These results demonstrate the Company's strong profitability and effective strategic execution. However, BYD’s ROE, although slightly lower, has had a good expansion from 5.5% in 2020 to an expected 12.2% in 2023 (BYD Company Limited, 2021, 2022, 2023). This may be attributed to new market entry into the EV market and an increase in the Company's operational scale. Nevertheless, comparing BMW and BYD, it is possible to state that BMW has a more stable and higher ROE than BYD. At the same time, the latter Company demonstrates distinct progress in changing the value added to shareholders.
The same is true with the Net Profit Margin, which shows the share of the total sales that translates to Profit after expenses have been made. The operating margin of BMW remains high over the period and increases from 5.2% in 2020 to 9.1% in 2022, then drops to 8.9% in 2023 (BMW Group, 2021, 2022, 2023), reflecting consistent cost control and strong pricing strategies in premium markets. In contrast, BYD’s net profit margin more than doubled, from 2.3% in 2020 to 4.8% in 2023, showing significant improvement but from a much lower base (BYD Company Limited, 2021, 2022, 2023), showing that the Company could control production costs while increasing production volumes. Hence, while BMW presents considerably higher absolute profit margins because of its positioning, BYD demonstrates a more aggressive upward trend, suggesting greater recent improvements in operational efficiency.
In terms of earnings per share (EPS), BMW also demonstrates rather impressive figures of shareholder value creation as EPS increases from € 7.40 in 2020 to € 13.50 in 2022 and slightly declines to € 13.00 in 2023 (BMW Group, 2021, 2022, 2023). This indicates a continuous income increase and proper control of shares. On the other hand, BYD's EPS has risen from $0.42 in 2020 to $1.30 in 2023 (BYD Company Limited, 2021, 2022, 2023), which shows that the Company has expanded its bottom line to cater to the increasing demand and better operations. While BMW has a higher EPS, on average, the growth trend of BYD demonstrates the Company's potential to become a significant player in the EV market. Regarding financial position, BMW's total assets grew from €242 billion in 2020 to €260 billion in 2023 while maintaining robust operating cash flows. In conclusion, both companies' Net Margin and ROE dynamics are consistent. BMW is stable and mature, and BYD is in high growth. BMW is more profitable in terms of absolute value, but BYD has more growth momentum.
Liquidity and Short-Term Financial Health
Liquidity ratios act as an important tool in determining the ability of an enterprise to meet its short-term financial obligations, which is particularly significant in industries that heavily invest in capital, such as the automotive manufacturing industry. From 2020 to 2023, BMW has recorded a Current Ratio of 1.19 to 1.25, reflecting tight but efficient short-term asset management with confidence in managing liabilities. This consistency indicates a sound management of the working capital, which must be available to meet current obligations and fund future investments in R&D. On the same note, the current ratio of BYD has a slight improvement from 1.06 in 2020 to 1.15 in 2022 but a slight reduction to 1.13 in 2023 (BYD Company Limited, 2021, 2022, 2023). The upward trend shows BYD’s deliberate efforts to improve liquidity amid expansion, but with more volatility than BMW. Comparatively, BMW's consistently stronger current ratio implies greater liquidity safety, while BYD's slightly improving trend indicates a transitioning company expanding rapidly but continuing to manage the requirements for working capital. BYD's fluctuating ratio may result from significant investment in production facilities and R&D, temporarily dampening coverage of current assets. For Current Ratio vs. Debt-to-Equity, both companies, enhancing liquidity goes along with enhancing solvency, although BMW does this more conservatively. BMW is more liquid and less volatile, which is consistent with BMW's risk-averse, premium-branded positioning. The improvement in BYD's liquidity facilitates its rapid expansion, but it can be constrained if growth exceeds the internal cash generation. Below is a table with the key ratios from 2020 to 2023.
Table 1: Financial Ratio Comparison (2020 to 2023)
|
Metric |
BMW (2023) |
BYD (2023) |
BMW (2022) |
BYD (2022) |
BMW (2021) |
BYD (2021) |
BMW (2020) |
BYD (2020) |
|
Return on Equity (ROE) |
14.5% |
12.2% |
15.8% |
11.9% |
13.7% |
10.6% |
9.2% |
5.5% |
|
Net Profit Margin (%) |
8.9% |
4.8% |
9.1% |
4.2% |
7.2% |
3.9% |
5.2% |
2.3% |
|
Current Ratio |
1.20 |
1.13 |
1.22 |
1.15 |
1.19 |
1.10 |
1.25 |
1.06 |
|
Debt-to-Equity Ratio |
0.68 |
0.48 |
0.71 |
0.52 |
0.75 |
0.56 |
0.81 |
0.59 |
|
Revenue Growth (%) |
5.3% |
35.7% |
12.5% |
44.8% |
3.9% |
38.5% |
(6.1%) |
20.5% |
|
Earnings Per Share (EPS) (€/$) |
€13.00 |
$1.30 |
€13.50 |
$1.15 |
€10.70 |
$0.95 |
€7.40 |
$0.42 |
Sources: BMW Group Annual Reports, 2020–2023; BYD Company Limited Annual Reports, 2020–2023.
Summary of Financial Statement Trends (2020–2023)
Across the 2020 to 2023 period, both BMW and BYD have demonstrated distinct trends in their core financial statements, reflecting their contrasting stages of maturity and growth. BMW’s income statement shows consistent top-line recovery post-COVID, with revenues rising from €98.99 billion in 2020 to €155.49 billion in 2023, supported by high-margin product lines and stable cost control (BMW Group, 2020–2023). Its net profit peaked at €18.58 billion in 2022, before a modest reduction to €17.11 billion in 2023, suggesting resilience amid inflationary pressures. On the balance sheet, BMW expanded its asset base by nearly €40 billion, while reducing its debt-equity ratio, highlighting prudent capital deployment. In contrast, BYD’s income statement reflects exponential growth, with revenues surging from CNY 156.60 billion to CNY 602.31 billion, and net profit multiplying sevenfold in just four years(BYD Company Limited, 2020–2023). Asset growth has been equally dramatic, reaching CNY 698.14 billion by 2023. BYD’s improved net profit and cash flow performance signal that its aggressive expansion is underpinned by increasingly robust internal funding, a promising sign for investors assessing financial sustainability.
Long-Term Solvency and Capital Structure
Solvency ratios give information about the ability of the business to meet its long-term financial obligations. For instance, BMW's Debt-Equity Ratio has been reduced from 0.81 in 2020 to 0.68 in 2023 (BMW Group, 2021, 2022, 2023), hence indicating that the Company has been steadily opting for less debt and is in a better position in terms of its equity and liabilities. This improvement is due to the increased operating cash flow and the Company's continued focus on using internally generated funds to finance its expansion needs. Likewise, in capital structure management, BYD has optimized the debt-equity ratio from 0.59 in 2020 to 0.48 in 2023 (BYD Company Limited, 2021, 2022, 2023). This is even more evident given BYD's expansion in production capacity and technology advancement goals over the last few years. BMW’s greater D/E ratio is consistent with its seasoned capital structure, even deploying debt for growth without weakening the equity buffer. Despite high growth, BYD’s lower D/E ratio demonstrates excellent internal financing and potentially more dependence on equity capital or retained earnings. The decline in D/E, coupled with the rise in the net margin and the ROE for these two companies, signifies effective cash generation and financial prudence. However, BYD’s dramatic improvement highlights strategic capital management in light of aggressive scale-up. Both firms are deleveraging, indicating strong balance sheet strategies. BMW has a more risky capital structure but more assets to back it up and stable earnings. Its low debt/equity ratio is a testament to prudent debt usage for high growth.
Revenue Growth and Top-Line Performance
Analyzing revenue trends to get a broader picture of the Company's financial situation is worthwhile. Graph 2 shows a vivid picture of revenue growth from 2020 to 2023.
Graph 2: Revenue Growth Rates (%): BMW vs. BYD (2020–2023)
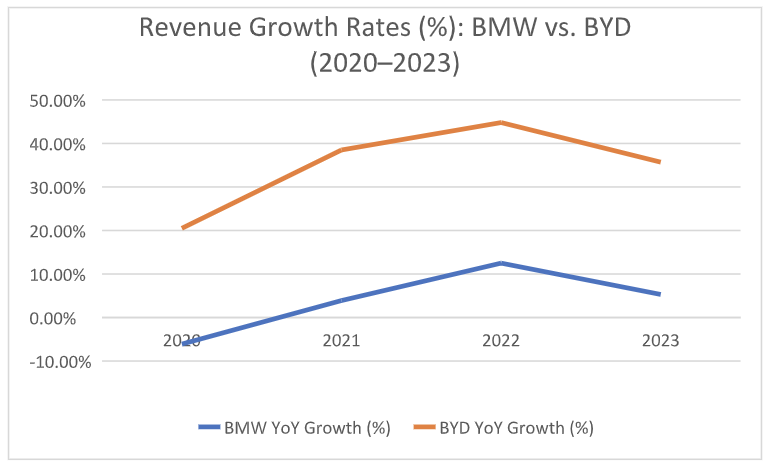
BMW Group reported a drop in revenue in 2020 of 6.1%, which was attributed to the COVID-19 disruptions across the globe (BMW Group, 2021). However, the Company bounced back with overall revenues of 3.9% in 2021, 12.5% in 2022, and 5.3% in 2023 (BMW Group, 2022, 2023). This rebound proves that BMW is operationally flexible and has a robust supply chain, while consumers are seeking more of its luxury cars, hybrids, and electric vehicles under the BMW i division. Meanwhile, BYD's revenues have been growing at a much faster pace over the same period, with growth rates of 20.5% in 2020, 38.5% in 2021, 44.8% in 2022, and 35.7% in 2023 (BYD Company Limited, 2021, 2022, 2023). Such figures prove that BYD's market share is constantly increasing, which can be explained by its overwhelming position in the Chinese market and its increasing presence in the global market. For example, BYD announced plans in 2023 to establish its first European EV factory in Hungary. While BMW demonstrates gradual improvement and is a sign of sustainable and brand-focused growth, BYD points to the future as a high-growth challenger to the establishment in the global automobile industry. Below is a comparison summary table of the key ratios driving this change in growth.
Leave assignment stress behind!
Delegate your nursing or tough paper to our experts. We'll personalize your sample and ensure it's ready on short notice.
Order nowTable 2: Final Summary Comparison Table: Ratio Relationships and Trends
|
Metric |
BMW: Trend (2020–2023) |
BYD: Trend (2020–2023) |
Comparative Insight |
|
ROE vs. Net Margin |
Both increased steadily, with strong alignment |
Both increased rapidly on a low base |
BYD is growing faster; BMW has higher stability and returns |
|
Net Margin vs. Revenue Growth |
Moderate revenue growth, stable margins |
High revenue growth, improving margins |
BYD scales profitably; BMW grows cautiously |
|
Current Ratio vs. D/E Ratio |
Stable liquidity, reducing leverage |
Slight liquidity improvement, reducing D/E |
BYD balances growth with prudent financing |
|
EPS vs. ROE |
Aligned and high |
Aligned, lower, but growing |
BYD shows strong EPS growth momentum |
Cash Flow and Financial Flexibility
Operating cash flow is the cash generated from the main business. Free cash flow is an important measure of financial health, as it helps to fund capex, R&D, and dividends without excessive dependence on external debt. BMW has historically produced high operating cash flows, indicative of consistent top-line revenue and mature operational efficiency. During the four years ending with 2023 (2020–2023), BMW grew its operating cash flow from €7.42 billion to €19.07 billion. The positive cash position empowers BMW to invest confidently in electrification, self-driving cars, and sustainability initiatives in balance with a consistent shareholder return (BMW Group, 2021, 2022, 2023). In stark contrast, BYD operated a steep upward cash flow, going from just CNY 21.94 billion in 2020 to CNY 78.54 billion in 2023. The EV sales growth and well-executed working capital management primarily drive this enhancement (BYD Company Limited, 2021, 2022, 2023). While BYD has always been financed with less dependence on external funds, its growing cash inflow from operations means it has more flexibility to finance R&D and manufacturing scale-up in-house. Below is a table with the operating cash flow for both BMW and BYD from 2020 to 2023.
Table 3: Operating Cash Flow Comparison (2020–2023)
|
Year |
BMW Operating CF (€ bn) |
BYD Operating CF (CNY bn) |
|
2020 |
7.42 |
21.94 |
|
2021 |
16.37 |
31.75 |
|
2022 |
20.80 |
50.66 |
|
2023 |
19.07 |
78.54 |
Thanks to the mature market and all established revenue streams, BMW is still on a more stable and cash-rich foundation. On the other hand, BYD, which relied more heavily on debt in the past, is now demonstrating that its historically high-growth strategy within the EV market is generating sufficient internal cash to sustain itself.
Key Drivers of Financial Outcomes
Their different strategies and cost control can explain the different financial results of BMW and BYD. Both companies have shown impressive growth at the top-line level. However, the heart of the profitability comes in their strength in managing operational costs, mainly COGS, Selling and marketing Expenses, Administrative Costs, and R&D Investments.
BMW: Premium Positioning with Stable Cost Structure
The financial model of BMW is based on operational efficiency in cost control, which is especially true in the COGS and marketing fields. While revenues at BMW increased from €98.99 billion in 2020 to €155.49 billion in 2023, the cost base remained relatively constant, and the Company achieved a gross profit margin of 20.9% in 2023 versus 17.6% in 2020 (BMW Group 2020–2023). The expansion in margin is clear evidence of improvement in production and supply chain efficiency, even under high inflation and raw material volatility.
|
BMW Cost Category |
2020 (€ bn) |
2023 (€ bn) |
Change |
Commentary |
|
COGS (Production Costs) |
81.54 |
122.88 |
↑ €41.34 bn |
Increased with production scale, but proportionally less than revenue growth |
|
Selling & Marketing Expenses |
5.21 |
6.18 |
↑ €0.97 bn |
Stable as % of revenue (~4%), showing tight marketing spend control |
|
General & Admin Expenses |
2.10 |
2.34 |
↑ €0.24 bn |
Consistently low, reflecting lean management operations |
|
R&D Expenses |
5.69 |
7.13 |
↑ €1.44 bn |
Strategic investment aligned with innovation (e.g., EVs and autonomy) |
Driver Summary is as follows;
Cost Control: Strong marketing and admin cost management, keeping them proportional to sales. Efficiency Gains: Improved COGS-to-revenue ratio reflects economies of scale and supply chain resilience. Strategic Investment: Higher R&D spending to future-proof premium EV product lines.
BYD: Aggressive Expansion with Economies of Scale in COGS
The revenues for BYD multiplied a staggering 3.84 times from CNY 156.60 billion in 2020 to CNY 602.31 billion in 2023, with significant cost leverage on COGS and strong vertical integration at play. Because BYD makes its batteries, powertrains, and semiconductors, it has reduced its reliance on external procurement. While BYD has made heavy investments, its gross margin grew only from 17.3% in 2020 to 20.2% in 2023 (BYD Company Limited, 2020–2023).
|
BYD Cost Category |
2020 (CNY bn) |
2023 (CNY bn) |
Change |
Commentary |
|
COGS |
129.52 |
480.34 |
↑ CNY 350.82 bn |
Increase proportionate to revenue but reflects scalable production |
|
Selling & Marketing Expenses |
5.32 |
11.88 |
↑ CNY 6.56 bn |
Increased, but only by ~2% of revenue, showing cost-effective growth. |
|
General & Admin Expenses |
4.78 |
9.67 |
↑ CNY 4.89 bn |
Controlled considering 4x revenue growth |
|
R&D Expenses |
9.06 |
34.42 |
↑ CNY 25.36 bn |
Massive investment in EV platforms, battery tech, and AI-driving |
Driver Summary: Cost Control: BYD has achieved scale-driven reductions in per-unit manufacturing costs, primarily through COGS control via vertical integration. R&D-Driven Growth: Aggressive R&D funding has fueled innovation in EV platforms, bolstering market competitiveness. Marketing Efficiency: BYD maintained low marketing costs relative to revenue, benefiting from organic brand recognition in China and expanding overseas markets.
Comparative Insight: What Drives Financial Outcomes?
|
Financial Driver |
BMW |
BYD |
|
COGS Management |
Efficient production in premium space |
Vertical integration lowers manufacturing costs |
|
Admin/Marketing Control |
Lean operations, flat admin costs |
Low S&M expenses as % of revenue |
|
R&D Focus |
Steady innovation (EV, autonomy) |
Rapid R&D scale-up for market dominance |
|
Margin Outcome (2023). |
Gross: 20.9%, Net: 11% |
Gross: 20.2%, Net: 5% |
BMW has a mature cost structure (especially regarding selling and administrative costs), steady R&D for premium innovation, and financial strength. Get a Load of BYD has successfully maintained cost control at the expense of margins, with relentless vertical integration leading to COGS scale efficiency and little spent on marketing, flying to capture EV market share. At the same time, in hyper-growth mode, pumping its full cash flow into R&D, these are not just high-level but evidenced cost drivers that illustrate BMW's attraction to risk-averse long-term value investors. At the same time, BYD embodies a fast-moving growth model with better cost operating leverage and innovation-led profitability.
Non-Financial Performance (2020–2023)
ESG Performance
Environmental Impact
Both BMW and BYD have achieved great things in the environmental aspect between 2020 and 2023. BMW has lowered the amount of CO2 emissions per produced car; it was 40% lower than the 2019 level by 2023 due to the increased use of renewable energy sources in production facilities and a wider range of electric cars (BMW Group, 2023). BMW also focused on the efficient use of resources, such as water consumption per car, which was cut by 32 percent, and the efficiency of waste recycling in manufacturing facilities was increased. On the other hand, BYD's environmental strategies were more centered on massive battery recycling projects and attaining a carbon-free status in several of its manufacturing plants in China by 2023 (BYD Company Limited, 2023). In 2023, BYD recycled more than 30,000 metric tons of end-of-life EV batteries by recovering critical raw materials, including lithium, cobalt, and nickel, through its vertically integrated recycling units. BYD also made strides in its solar energy storage, expanding to 13 countries and deploying 3.5 gigawatt-hours (GWh) of energy storage capacity. The Company added to its public electric transit division, which blossomed, exporting over 9,500 electric buses and taxis to Southeast Asia. Such factors have also rightfully placed BYD front and center as a leader in the field of global sustainable urban transport and clean energy technology.
Social Impact
In the four years from 2020 to 2023, BMW and BYD targeted their social value creation, but they came from very different positions and had slightly different focuses on their social value creation. In contrast, BMW focused on sourcing responsibly and transparency in the supply chain, obtaining 100% traceability for its most essential raw materials like cobalt and lithium for its EV batteries (BMW Group, 2023). The Company is also committed to enhancing labour rights monitoring across its global supply chain and scaling up community engagement programs, which include education programs that promote sustainable mobility and sustainable living, especially in European markets. In contrast, BYD’s social impact journey has been more corrective, as criticism regarding poor working conditions and violations of labour laws was experienced between 2020 and 2021 (Liu et al., 2023). In response, BYD reformed considerably, especially with the introduction of the "Green Future Community Initiative," which provided over CNY 1 billion (~USD 140 million) to public health, education, and green transport infrastructure development for impoverished areas like Sichuan, Henan, and Guangxi (Liu et al., 2023). This included things such as 2,000 electric buses and solar-powered schools. Moreover, BYD collaborated with local authorities and NGOs to provide vocational training for migrant workers and women studying STEM. This led to a 40% rise in certified technicians employed from rural areas by 2023. As a result, BYD has significantly enhanced its ESG performance in this respect, with its community score upgraded from A-level in 2021 to AA-level in 2022 by Sustainalytics and MSCI (Liu et al., 2023). BMW remains ahead of its peers in bureaucratic compliance and supply chain ethics. At the same time, BYD checks the boxes of a new socially transformative strategy of rapid community reinvestment and ramp-up of workforce development, driven in part by BYD's growth ambitions at home.
Governance Practices
Another area that separates the two companies is governance practices. BMW increased female board members to 33% by 2023 and advanced executive pay regulation contingent on ESG performance (BMW Group, 2023). Its risk management framework also developed changes to reflect climate-related financial disclosures in line with TCFD guidance. At the same time, BYD enhanced corporate governance by increasing the number of independent board members and enhancing shareholder communication (BYD Company Limited, 2023). Nevertheless, the compliance of BYD with the best practices of international governance is still questionable compared to the well-developed structure of BMW.
Innovation and R&D
In 2020 and 2023, BMW and BYD doubled R&D expenditure to foster innovations in key emerging megatrends, including EVs and digital technologies. About R&D, BMW set aside around €7.2 billion per year (BMW Group, 2023), emphasizing both e-drivetrains, battery efficiency, and autonomous driving systems. That translated to the launch and success of flagship models like the BMW i4 or the BMW iX, securing BMW in the electromotive premium segment. Combining intelligent driving characteristics and sustainable materials in new product lines leveraged BMW’s brand differentiation. It protected competitive advantages in mature and growth markets within Europe and North America.
In comparison, by 2023, BYD was investing about 7% of its annual revenue in R&D (BYD Company Limited, 2023), with a focus on vertical integration to battery technology, power semiconductors, and EV architecture by investing 34.42 CNY bn, as shown in Appendix 2. This led to key inventions such as the Blade Battery, which solved fire safety issues, and the blistering expansion of EV product lineups such as the Dynasty (or volume) and Ocean series. The fact that BYD had internal control of its core technologies meant it could iterate faster and keep costs lower, further cementing its status as a vertically integrated leader of EVs. In summary, BMW bent its R&D to maintain premium brand equity, while BYD aggressively innovated and scaled to upend and grow its presence in mass-market segments worldwide.
Brand Reputation and Customer Satisfaction
BMW maintained a strong global brand image between 2020 and 2023, supported by its consistent ranking among the world’s top automotive brands. It was listed among the top ten in Interbrand’s Best Global Brands report, valued at over USD 51 billion in 2023 (Interbrand, 2023). Additionally, BMW ranked in the top three in YouGov Automotive Rankings for both Europe and the US, reflecting consumer appreciation for luxury, performance, and service quality (YouGov, 2023). BMW also received the highest score among luxury brands in the J.D. Power Customer Service Index (CSI) Study (2023), and its EV models, such as the i4 and iX, received widespread praise across social media, contributing to a global sentiment score of +34% according to Brand watch (2023).
In contrast, BYD’s brand presence grew significantly in China and other emerging EV markets. According to the YouGov Brand Index (2023), BYD improved its brand impression score by 12.5 points between 2021 and 2023. Its models, such as the Han and Dolphin, consistently received customer ratings of 4.7 out of 5 on review platforms like Auto home and Xiaohongshu (Chin et al., 2024). BYD's rising popularity was also evident in social media engagement, with over 1.2 million mentions on Chinese platforms in 2023 and a 22% year-on-year increase in net sentiment (Kantar Media, 2023). While BMW remains a premium global leader, BYD is positioning itself as a high-quality, cost-efficient challenger in global EV markets, with notable momentum in Southeast Asia, Latin America, and selected European countries.
Employee Satisfaction and Engagement
The level of satisfaction and engagement of the employees of both companies demonstrated general but not very consistent tendencies. The BMW Group has managed to maintain single-digit employee turnover rates below 5% annually for the years 2020 to 2023, which shows how committed the employees are to the organization. Ongoing employee engagement surveys suggested a high level of approval of the Company's culture, professional growth, and work-life balance policies during the COVID-19 pandemic. BMW also sought to strengthen the compensation structure for its employees by introducing various awards, such as the Global Excellence Awards, that focused on the innovation and operational excellence of different teams and departments. With the fast expansion of the workforce, the Company experienced increased turnover rates, which were estimated to range from 8% to 10% yearly during the same year (BYD Company Limited, 2023). Nevertheless, internal surveys indicated that satisfaction was on the rise because of better compensation, promotions, and increasing attention to the health and well-being of the employees. In 2022, BYD established official reward programs to enhance employee motivation due to innovation and production achievements.
Comparative Analysis (2020–2023)
Key Differences and Similarities
Both BMW and BYD had good financial and non-financial performance between 2020 and 2023, but specific trends were more apparent. In terms of the economic analysis, it is evident that BMW recorded higher absolute revenues and net profits, which align with its position in the premium segment (BMW Group, 2023). However, as the figures show, BYD had a lower starting point, and its revenue and profit growth rates were higher, mainly due to the active expansion of EV sales (BYD Company Limited, 2023). In the non-financial performance analysis, BMW had a better governance structure and stronger brand recognition globally. At the same time, BYD was stronger in its social contribution, especially in environmental conservation, through its production of renewable energy and batteries. One of the main similarities is that both companies are long-term oriented toward electrification and sustainability, which is revealed through substantial investments in R&D and decarbonization. Nevertheless, BYD's employees' satisfaction and retention rates were higher, and its fast-growing employee base was also a drawback, resulting in lower turnover rates but rising engagement scores. Thus, BMW was more mature and had stronger brand power, whereas BYD was more dynamic and more innovative at the same time.
Impact of Strategic Decisions
Strategizing was critical in the evolution of both firms from 2020 to 2023. BMW has been introducing more EV models, including the iX, i4, and the electrified 7 Series, to counter the diminishing demand for ICE vehicles (BMW Group, 2023). BMW increased the security of supply through battery partnerships, such as the Northvolt joint venture. One of the most significant strategic decisions made by BYD was the stoppage of ICE vehicle manufacturing in 2022 and the transformation into an NEV company (BYD Company Limited, 2023). This bold decision greatly helped expand BYD's market share in China and other emerging markets. Moreover, the Company's diversification of its revenue streams through international expansion to Europe, Australia, and Southeast Asia helped to spread the risk and make it less reliant on the domestic market. Neither BMW nor BYD undertook significant mergers or acquisitions between 2020 and 2023. Instead, both companies relied on organic growth strategies and strategic alliances. For example, BMW reinforced its electrification roadmap through a joint venture with Northvolt, a Swedish battery manufacturer, to co-develop high-performance battery cells. Likewise, BYD strengthened its international expansion strategy through vertical integration and the planned establishment of a manufacturing facility in Hungary.
Long-Term Sustainability of Performance
The current outlook for both BMW and BYD's performance is promising, but they have different weaknesses. BMW has the advantage of strong brand recognition and a spread-out market exhibiting a good mix of electric vehicles and luxury ICE vehicles (BMW Group, 2023). However, BMW faces increasing competition from Tesla, Mercedes-Benz, and new entrants from China, namely NIO. Current economic risks include supply chain disruptions, variations in energy costs, and geopolitical risks, especially in locations like China and Europe. Challenges relating to emissions and self-driving technologies are set to increase further, calling for more advances. BYD has strategic advantages in terms of battery technology leadership, vertical integration, and first-mover status in the complete electrification of vehicles (BYD Company Limited, 2023). However, BYD has geopolitical risks mainly in the form of trade barriers, particularly in Western countries, and growing competition from incumbent auto players and new-generation EV makers. It will be possible to achieve this through sustaining technological superiority, brand value generation, and effectively addressing regulatory issues in different regions.
Conclusion
From 2020 to 2023, BMW and BYD demonstrated distinct yet successful strategies in both financial and non-financial performance. BMW delivered strong profitability, efficient operations, and a premium market reputation underpinned by stable cash flows and disciplined R&D investment in electrification and autonomous technology (BMW Group, 2023). Its established global presence, combined with mature governance structures and loyal customer bases, makes it a compelling choice for investors seeking long-term, lower-risk returns.
In contrast, BYD showed rapid growth, particularly in revenue, net profit, and international brand perception, driven by vertical integration and sustained investment in innovation (BYD Company Limited, 2023). Its agile cost structure and aggressive expansion in global EV markets offer higher growth potential, though with a greater exposure to operational and geopolitical risks.
For investors, a blended strategy is advisable. BMW offers consistent returns and resilience, while BYD presents an opportunity for high-growth exposure in the global shift toward electrification. A portfolio combining BMW’s dependable foundation with selective investment in BYD provides diversification and strategic alignment with the evolving automotive future.
Appendix
Appendix 1: BMW AG (2020–2023)
- Revenue Growth: Driven by robust premium vehicle sales (especially EVs), BMW achieved record deliveries in 2023.
- Cost Control: Efficiency programs and flexible production systems helped manage material and logistics costs despite inflation.
- Capital Efficiency: Strong return on capital employed (ROCE) maintained through high-margin vehicle sales and disciplined investment in electrification.
|
Metric |
2020 |
2021 |
2022 |
2023 |
|
Revenue (€ bn) |
98.99 |
111.24 |
142.61 |
155.49 |
|
Net Profit (€ bn) |
3.86 |
12.46 |
18.58 |
17.11 |
|
R&D Expenses (€ bn) |
5.69 |
6.29 |
6.62 |
7.13 |
|
Total Assets (€ bn) |
229.52 |
229.53 |
263.18 |
269.86 |
|
Total Liabilities (€ bn) |
160.11 |
157.52 |
176.32 |
179.77 |
|
Cash Flow from Ops (€ bn) |
7.42 |
16.37 |
20.80 |
19.07 |
Observations
- Revenue increased significantly post-2020, boosted by digitalisation and EV strategy.
- Cost management and margin discipline led to historically high profits in 2021–2022.
- Strategic investments in autonomous driving and battery tech increased R&D intensity.
- Asset growth aligned with production and R&D expansion.
Appendix 2: BYD Company Ltd. (2020–2023)
Key Financial Performance Drivers
- Revenue Growth: Surged due to booming EV and battery sales, BYD became China's top EV maker.
- Cost Control: Improved vertical integration (battery, semiconductor, components) reduced dependency on suppliers.
- Capital Efficiency: Maintained healthy ROE through scale economies and government incentives.
Trend Analysis (2020–2023)
|
Metric |
2020 |
2021 |
2022 |
2023 |
|
Revenue (CNY bn) |
156.60 |
216.14 |
424.06 |
602.31 |
|
Net Profit (CNY bn) |
4.23 |
3.04 |
16.62 |
30.04 |
|
R&D Expenses (CNY bn) |
9.06 |
10.62 |
20.23 |
34.42 |
|
Total Assets (CNY bn) |
290.54 |
371.99 |
534.32 |
698.14 |
|
Total Liabilities (CNY bn) |
207.46 |
248.61 |
345.74 |
442.91 |
|
Cash Flow from Ops (CNY bn) |
21.94 |
31.75 |
50.66 |
78.54 |
Observations
- Revenue almost quadrupled from 2020 to 2023, reflecting massive EV adoption.
- Net Profit surged after 2021 as scale effects and internal cost efficiencies improved.
- BYD’s aggressive R&D spending underpinned battery and semiconductor innovation.
- Strong operating cash flow supported capital reinvestment and liquidity.
Offload drafts to field expert
Our writers can refine your work for better clarity, flow, and higher originality in 3+ hours.
Match with writerReferences
- BMW Group. (2020). Financial Statements of BMW AG 2020. BMW AG. [Online] Available at: https://www.bmwgroup.com/content/dam/grpw/websites/bmwgroup_com/ir/downloads/en/2021/bericht/Financial-Statements-of-BMW-AG_2020.pdf (Accessed on April 4, 2025)
- BMW Group. (2021). Financial Statements of BMW AG 2021. BMW AG. [Online] Available at: https://www.bmwgroup.com/content/dam/grpw/websites/bmwgroup_com/ir/downloads/en/2022/bericht/BMW-AG-Financial-Statements-2021-en.pdf (Accessed on April 5, 2025)
- BMW Group. (2022). Financial Statements of BMW AG 2022. BMW AG. [Online] Available at: https://www.bmwgroup.com/content/dam/grpw/websites/bmwgroup_com/ir/downloads/en/2023/bericht/BMW-AG-Financial-Statements-2022-en.pdf (Accessed on April 5, 2025)
- BMW Group. (2023). Financial Statements of BMW AG 2023. BMW AG. [Online] Available at: https://www.bmwgroup.com/content/dam/grpw/websites/bmwgroup_com/ir/downloads/en/2024/bericht/BMW-AG-Financial-Statements-2023-en.pdf (Accessed on April 4, 2025)
- Brandwatch. (2023). Automotive Sentiment and Social Listening Report. [online] Available at: https://www.brandwatch.com/brandwatch-index/automotive (Accessed on April 4, 2025)
- BYD Company Limited. (2020). Annual report 2020. BYD Global.[Online] Available at: https://www.bydglobal.com/sitesresources/common/tools/generic/web/viewer.html?file=%2Fsites%2FSatellite%2FBYD%20PDF%20Viewer%3Fblobcol%3Durldata%26blobheader%3Dapplication%252Fpdf%26blobkey%3Did%26blobtable%3DMungo (Accessed on April 5, 2025)
- BYD Company Limited. (2021). Annual report 2021. BYD Global. [Online] Available at: https://www.bydglobal.com/sitesresources/common/tools/generic/web/viewer.html?file=%2Fsites%2FSatellite%2FBYD%20PDF%20Viewer%3Fblobcol%3Durldata%26blobheader%3Dapplication%252Fpdf%26blobkey%3Did%26blobtable%3DMungoBlobs%26blobwhere%3D1638928309417%26ssbinary%3Dtrue (Accessed on April 5, 2025)
- BYD Company Limited. (2022). Annual report 2022. BYD Global. [Online] Available at: https://www.bydglobal.com/sitesresources/common/tools/generic/web/viewer.html?file=%2Fsites%2FSatellite%2FBYD%20PDF%20Viewer%3Fblobcol%3Durldata%26blobheader%3Dapplication%252Fpdf%26blobkey%3Did%26blobtable%3DMungoBlobs%26blobwhere%3D1638928375931%26ssbinary%3Dtrue (Accessed on April 4, 2025)
- BYD Company Limited. (2023). Annual report 2023. BYD Co., Ltd. [Online] Available at: https://www.bydglobal.com (Accessed on April 4, 2025)
- Chin, T.A., Yu, F., Tuan, L.Y. and Tat, H.H., 2024. Key Factors Influencing Consumer Purchase Intentions for Chinese Brand Electric Vehicles. International Journal of Business & Society, 25(3). [Online] Available at: https://unipub.unimas.my/ojs/index.php/IJBS/article/download/8559/2325 (Accessed on April 5, 2025)
- Interbrand. (2023). Best Global Brands 2023 Rankings. [Online] Available at: https://interbrand.com/best-global-brands/ (Accessed on April 5, 2025)
- J.D. Power. (2023). 2023 U.S. Customer Service Index (CSI) Study. [Online] Available at: https://www.jdpower.com/sites/default/files/file/2023-03/2023022%20U.S.%20CSI.pdf (Accessed on April 4, 2025)
- Kantar Media. (2023). Chinese Automotive Brand Social Listening Report. [Online] Available at: https://www.kantar.com/campaigns/brandz-downloads/kantar-brandz-most-valuable-chinese-brands-2024 (Accessed on April 4, 2025)
- Liu, N., Shang, C. and Yuan, J., 2023. Research on the Impact of ESG Rating on Enterprise Value in the New Energy Vehicle Industry Based on BYD. Advances in Economics, Management and Political Sciences, 54, pp.275-285. [Online] Available at: https://www.ewadirect.com/proceedings/aemps/article/view/7255/pdf#:~:text=According%20to%20the%20ESG%20rating,have%20been%20recognized%20by%20MSCI (Accessed on April 5, 2025)
- MSCI ESG Ratings (2023). BMW Profile. [Online] Availability at: https://www.knowesg.com/esg-ratings/bayerische-motoren-werke-aktiengesellschaft (Accessed on April 4, 2025)
- MSCI ESG Ratings (2023). BYD Profile. [Online] Available at: https://www.sustainalytics.com/esg-rating/byd-co-ltd/1013453658 (Accessed on April 4, 2025)
- YouGov. (2023). BrandIndex China and Global Automotive Rankings. [Online] Available at: https://business.yougov.com/product/categoryview/automotive (Accessed on April 4, 2025)
- Key Financial Performance Drivers
- Trend Analysis (2020–2023)
